Javascript Module Pattern, Memory, Closures
An update to Module Pattern, A Little More Detail, an article in which I first explained the idea of using closure’d objects as an alternative to Javascript’s new and prototype system objects.
It’s been a few months since my first article on the Javascript module pattern and I’ve learned and read a lot, thanks to whizzes like mraleph and John Firebaugh. Here’s an update.
Closures Can Be Less Memory-Efficient than Classical Objects
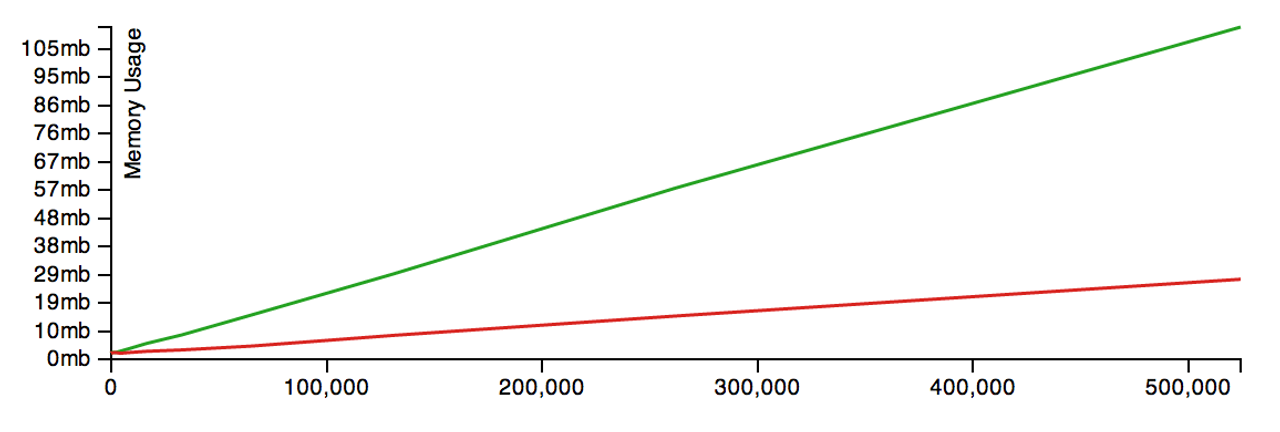
new-based objects in red, closure based objects in green. Both have linear impacts upon memory, but objects occupy significantly more space: at 524,288 instances, closure-based objects occupy 112MB, whereas classical objects occupy 27MB.
Here’s the code for that example - as far as I know, it’s kosher and pseudo-scientific but improvements are welcome.
The cause for this, grokking what’s possible Vyacheslav’s article, is that functions within a closure require the allocation of a V8 context for every object created, whereas functions on classical objects don’t require new scopes - they’re just automatically called with a this value.
Closure Variable Access is Slightly Slower
Vyacheslav Egorov eloquently explained this issue that was brought up by Marijn Haverbeke: accessing a closure variable - a variable in the scope of a closed-over function - is slower than accessing a member variable of a classical object using this.
The difference between the two is extremely minimal: Marijn saw a 2 to 3% speedup over a real-world codebase. Also, it’s neat that he was also using closure-objects in order to minimize size, which I wrote about a little while ago and didn’t expect many people to be too concerned about.
Closures are Slower to Initialize Than new
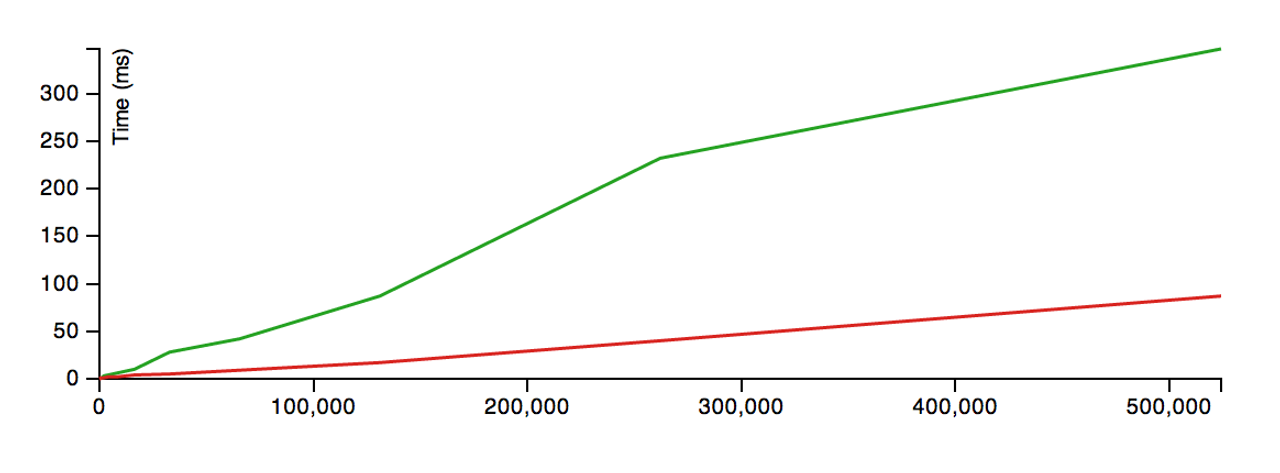
The code and data for this graph, using the same kind of object and same basic approach as before.
new-based objects in red, closure based objects in green. It takes 87ms to initialize 524,288 instances with new, and 347ms to initialize with closures. I'm assuming that this is caused by the increased cost of context objects as before with memory.
Petka Antonov writes that function objects, not contexts, are the reason for the memory-usage difference, and the difference is amplified as more functions are enclosed, since V8 stores a function object for each and every function created. Function objects occupy roughly 2x the size of regular objects in V8.
Using This Knowledge
Personally a 2% to 3% difference in lookup performance isn’t enough to influence my code style: I’m making a resolution to never optimize functions that take less than 10% of runtime, as a kind of guard on sanity and focus. Similarly, the speed difference in initialization isn’t that much of a concern. In this test, it’s between 0.00066ms and 0.00016ms: it’s unlikely that a performance penalty on that problem factors much into the overall picture.
The memory difference is much more important, and actionable, because Chrome’s heap profiler has become so mature and usable. For very heavily-allocated objects, it makes more memory-sense to use classical objects than closures.
In the iD project, this meant that large, asynchronous sections, like iD.Map, the map object, are classical, while heavily-allocated data objects like iD.Node (a holder for any node from OSM - we often handle thousands) are implemented with classical objects.
If you look closely at the d3 project, it make some interesting moves regarding how it declares functions: utility functions for heavily-allocated objects lie outside the object scope. This is an interesting way to go forward, and may lead to more easily optimized code on the V8 side.
As always, there’s a balance between speed, complexity, and developer happiness. Choose wisely.